Over ten days I documented my use of media to analyse and compare with that of my fellow JOUR1111 students.
The results were surprising in some cases though predictable in others. The one failing I found with this project was it didn't recognise multi-tasking. It is not unusual that I might be watching T.V, working in Microsoft Word, browsing Facebook or reading articles simultaneously.
My results are recorded in minutes below. On average I spend about 10 hours using media per day. The types of media I used greatly depended on a variety of external factors.
For example on the Saturday I went to a gig, which meant I used my iPhone Camera 40 times more than my previous average and didn't use my computer at all. This was not a result of a typical Saturday, just this particular date.
Media Diary Minutes Per Day
[March
7th-17th]
TECHNOLOGY
|
DETAIL
|
THUR
|
FRI
|
SAT
|
SUN
|
MON
|
TUE
|
WED
|
THUR
|
FRI
|
SAT
|
TOTAL
|
iPhone
|
Email
|
10
|
5
|
10
|
0
|
10
|
5
|
10
|
10
|
20
|
0
|
80
|
iMessage
|
30
|
10
|
15
|
30
|
15
|
20
|
30
|
40
|
40
|
40
|
270
|
|
Telephone
|
20
|
30
|
30
|
70
|
20
|
20
|
50
|
60
|
50
|
70
|
420
|
|
Instagram
|
20
|
15
|
10
|
0
|
10
|
5
|
15
|
10
|
10
|
30
|
125
|
|
ANZ
|
2
|
1
|
0
|
0
|
5
|
5
|
5
|
10
|
0
|
10
|
38
|
|
Triple J
|
10
|
0
|
0
|
10
|
20
|
0
|
10
|
20
|
15
|
40
|
125
|
|
Facebook
|
5
|
10
|
10
|
10
|
10
|
10
|
5
|
15
|
15
|
30
|
120
|
|
Twitter
|
5
|
0
|
10
|
10
|
10
|
10
|
0
|
0
|
15
|
10
|
70
|
|
Camera
|
1
|
1
|
5
|
0
|
0
|
0
|
5
|
5
|
0
|
80
|
97
|
|
iPod
|
90
|
60
|
70
|
30
|
80
|
70
|
15
|
45
|
80
|
30
|
570
|
|
193
|
132
|
160
|
170
|
180
|
145
|
95
|
215
|
245
|
340
|
1915
|
||
T.V
|
ABC 1
|
30
|
0
|
30
|
0
|
60
|
0
|
90
|
0
|
40
|
20
|
270
|
ABC 24
|
15
|
15
|
30
|
0
|
0
|
15
|
15
|
30
|
0
|
30
|
150
|
|
ABC 2
|
40
|
0
|
0
|
0
|
40
|
60
|
40
|
0
|
0
|
0
|
180
|
|
Ten
|
60
|
0
|
0
|
210
|
60
|
30
|
60
|
160
|
60
|
0
|
640
|
|
145
|
15
|
60
|
210
|
160
|
105
|
205
|
190
|
100
|
50
|
1240
|
||
Internet
|
Facebook
|
0
|
0
|
20
|
0
|
20
|
10
|
20
|
20
|
20
|
0
|
110
|
Twitter
|
10
|
0
|
0
|
0
|
10
|
15
|
15
|
30
|
40
|
0
|
120
|
|
Last.fm
|
15
|
5
|
0
|
10
|
15
|
10
|
10
|
5
|
10
|
0
|
80
|
|
NewsOnline
|
10
|
10
|
30
|
20
|
10
|
0
|
10
|
5
|
20
|
0
|
115
|
|
UniReading
|
50
|
20
|
0
|
40
|
30
|
40
|
20
|
15
|
0
|
0
|
215
|
|
Blogspot
|
0
|
0
|
0
|
0
|
0
|
0
|
70
|
60
|
30
|
0
|
160
|
|
Misc.
|
20
|
10
|
20
|
10
|
0
|
10
|
20
|
10
|
0
|
0
|
100
|
|
95
|
35
|
70
|
80
|
85
|
85
|
165
|
145
|
120
|
0
|
960
|
||
Computer
|
iTunes
|
20
|
20
|
70
|
30
|
0
|
60
|
80
|
90
|
0
|
0
|
370
|
VLC
|
30
|
90
|
60
|
0
|
60
|
30
|
0
|
150
|
190
|
0
|
610
|
|
Mic. Word
|
90
|
60
|
10
|
150
|
80
|
120
|
60
|
80
|
90
|
0
|
650
|
|
140
|
170
|
140
|
180
|
140
|
210
|
140
|
290
|
280
|
0
|
1630
|
||
Print
|
Magazines
|
30
|
10
|
0
|
0
|
40
|
30
|
30
|
0
|
0
|
15
|
155
|
Newspaper
|
0
|
0
|
20
|
30
|
0
|
0
|
20
|
20
|
0
|
0
|
90
|
|
Novels
|
0
|
0
|
30
|
0
|
0
|
20
|
30
|
0
|
0
|
0
|
80
|
|
30
|
10
|
50
|
30
|
40
|
50
|
80
|
20
|
0
|
15
|
325
|
||
TOTAL
MEDIA USE PER DAY
|
593
|
362
|
480
|
670
|
605
|
595
|
685
|
860
|
745
|
405
|
5970
|
|
SOCIAL MEDIA
In almost every example my results were in the minority or people who extensively used certain social platforms.
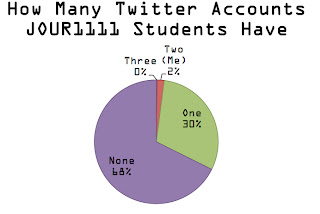 |
| Figure 1 |
There are over 300 Million people currently using Twitter world-wide. It remains one of the only social networking platforms where celebrities, politicians and other public figures interact on the same level as the general public.
Despite this, 68% of students surveyed did not have a Twitter account (Fig. 1). I found myself in the minority of people who have multiple accounts as I use Twitter both for personal use and the promotion of volunteer organisations I work with.
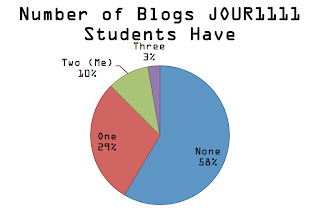 |
| Figure 2 |
Blogs are often used by journalists as a way of communicating with an audience outside the boundaries of corporate publications. Once again I was in the minority, having multiple Blogging accounts for my various interests (Fig. 2).
 |
| Figure 3 |
Overall I use Facebook more than other social media (Fig.3). This was a surprise to me however I'd attribute it to the fact that since moving interstate I use it more to keep in touch with friends and family at home.
SMART PHONES
I own an iPhone 4 which places me in the majority of JOUR1111 students surveyed as the most popular smart phone was the iPhone (Fig. 4). On average I use my iPhone for 2.5 hours a day. It is an integral part of my daily routine and I rely on it completely for communication purposes as my flat does not have a land line or an internet connection (yet!).
 |
| Figure 4 |
The survey results showed that the majority students predominately used the Facebook App (Fig.5). Although I do use the app, it does not stand out as the single most-used App on my phone. Figure 6 shows that I use other Apps such as Instagram, Triple J and Twitter as much, if not more than Facebook.
 |
| Figure 5 |
 |
| Figure 6 |
INTERNET & COMPUTERS
I am the proud owner of a Mac Book Pro. Only 34% of the students surveyed use Mac computers consistently though this is a minority I am happy to be a member of!
 |
| Figure 7 |
On average I use the internet 1.5 hours a day although this was not including the iPhone Apps. There was a fairly even spread of students using anyway between 1 and 4 hours of internet a day (Fig. 8).
 |
| Figure 8 |
TELEVISION
On average I watch 2 hours of TV per day, a surprising amount of this was actually news updates, question time in Parliament and less surprisingly, Dr Who reruns. Some 30% of the class also watched between 1-2 hours per day which was the largest group.
MUSIC & RADIO
During the ten days I didn't actually listen to any radio because I used to always listen to it in the car and in Brisbane I do not have one.
I do listen to a lot of music using the iPod on my iPhone and iTunes when on my computer. The convenience and mobility of the iPod allows me to listen to music on public transport and walking to and from work.
 |
| Figure 9 |
PRINT MEDIA
Overwhelmingly my use of 'New Media' eclipsed the minor amount of print media that I read (Fig. 10). This is not an average week for me, at home I am subscribed to Triple J Mag, New Music Express and my then local paper. I have not had time to renew these subscriptions since my move.
This can also largely be attributed to the fact I do all university readings on my computer because a) I don't have a printer and b) My inner environmentalist doesn't want to print things.
 |
| Figure 10 |
CONCLUSION
The most surprising thing I found about this project was just how little social media (other than the ever-popular Facebook) my class mates used. I can't imagine not having all of these different platforms to communicate ideas and express myself... it's fun!
No comments:
Post a Comment